
The UK Economic and Social Research Council wisely commissioned a range of research around academic issues raised by the independence referendum and six months on some of the results are beginning to appear.
Foremost amongst those funded was the Centre on Constitutional Change, based at Edinburgh University but involving other institutions too. They have just launched the first results of their Scottish Referendum Study, reporting results of a survey of about 3,700 people between late August and late-September last year.
Those results have been quite widely covered in the media, for example by the BBC and the Daily Record and I won’t repeat what they say. The link to the survey above is a slide presentation. I haven’t seen the full report, indeed don’t know if it’s available yet, but wanted to just dwell on a couple of aspects with implications for those of us who believe in the union – the ‘who voted Yes or No by age’ issue (I have discussed this before); and the significance of why people voted Yes or No.
Who voted Yes or No by age group
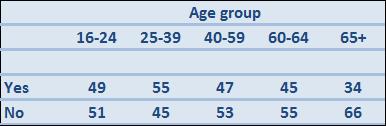
First, there are now three sample surveys that report Scots’ views around the time of the referendum and what they say about this issue is summarised in the three tables. A couple of qualifications. The ESRC survey was also carried out by YouGov. I suspect they are different exercises but in any event the results are reported differently so I have included both here. All three are reputable and I am sure were properly conducted. Like all sample surveys they are prone to some statistical error. It would take a qualified statistician to confirm what that might be in each case but my guess is that any estimate is correct with 2% points or slightly less. That would mean for example that the very first estimate below, the proportion of 16-24 year olds who said they voted Yes in the YouGov survey would mean the real proportion of all 16-24 year olds was between 47% and 51%.
YouGov
Ashcroft
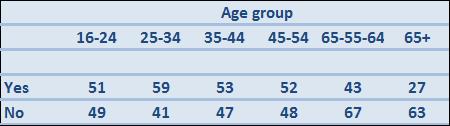
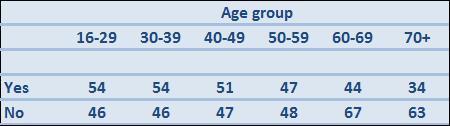
ESRC

Understanding the detail of the figures is made difficult by the fact that each chooses different age bands to report its results. My point in my previous post on this subject was that the stereotype that ‘young people voted Yes and pensioners voted No’ was far from true. The ESRC survey is slightly different in that it shows a continuous decline of Yes voters with age, whereas the other two suggest that their youngest age groups are rather less keen for independence than their immediate elders.
In any event there is clearly some association of age with enthusiasm for/scepticism about separation. The big question is how this might pan out in future. An assumption by some is that as the youngest voters move into older age groups and the eldest die, the proportion wanting independence will inevitably increase. I’m not so sure. That ignores future new young people becoming eligible to vote and the fact that more and more people are living longer, the ESRC’s over 50s age groups for example, majorities of all who voted No. It also ignores how people’s views change with age. One result of the ESRC survey showed that housing owner-occupiers were strongly in favour of No and we know that as they move into young middle age many people become owner-occupiers for the first time.
So the jury’s out on how different age groups might vote in (heaven forfend) any future referendum. But when we know the effort the SNP are putting into trying to make an impact on young people’s lives eternal vigilance, as they say in the classics, is required.
Why people voted Yes or No
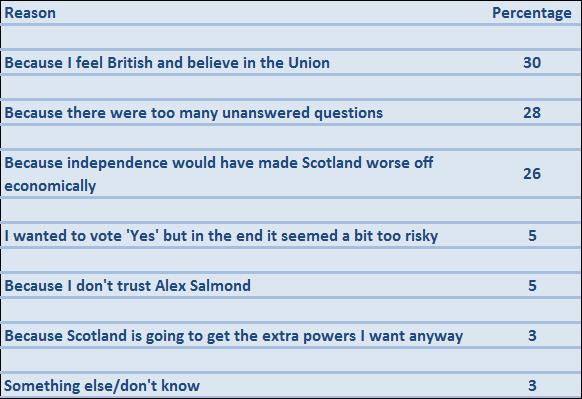
The ESRC survey addresses this topic directly in a way that the other two did not. The following tables summarise what each said. The numbers involved are much smaller than the main survey and so the statistical error will be rather more than 2%. Because percentages add to 100%, I assume people were asked the ‘main’ reason they voted the way they did although the source does not confirm that.
No voters – reasons for voting No
Yes voters – reasons for voting Yes
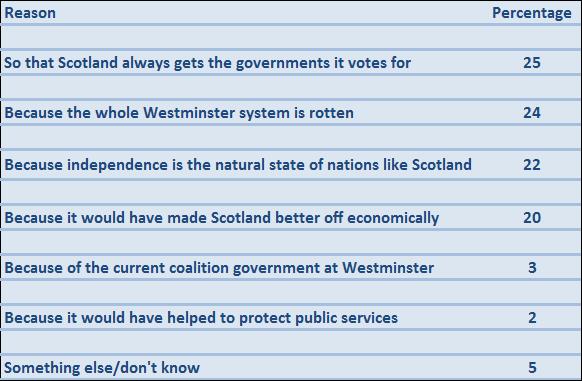
A general comment on both these tables first. One of the features of the referendum campaign was the extent to which the Yes side claimed that their reasons for wanting independence were positive whereas the No campaign could only come up with negative reasons for their case. These tables show, and it should be no surprise, that the reasons people gave on both sides were a mixture of positive and negative.
That’s one myth about No voters demolished. Another is the often-repeated claim, not least by Alex Salmond, that it was ‘The Vow’ what done it. I’ve touched on Salmond and the so-called vow before. But these figures confirm that, at least in this sample, only 3% of No voters cited a belief that extra powers would come to Scotland as a reason for their vote.
As to the many other reasons people gave for voting either way, the message for those of us who believe in the union is that each needs to be addressed individually in future. For example, No voters were very sceptical about the state of the economy in an independent Scotland, whereas Yes voters tended to believe that an ‘iScotland’ would be better off economically. There is in fact a wealth of evidence that the ‘Nos’ were right, from academic economists through bloggers like the excellent Kevin Hague to international agencies. The message here is one that needs to be constantly reinforced and tailored for different groups of people.
Time may be the great healer in relation to some of the other issues. For example, there may be no UK coalition to disappoint Yes voters after the May general election. Some may play out in unexpected ways. For example, 5% said their main reason to vote No was distrust of Alex Salmond. While I hope fervently he is not elected in May, it may well be that if he is his antics and disruption at Westminster, not to mention increasing tension with the real (?) leader of the SNP, Nicola Sturgeon, turn more against his party.
And so one could go through each of the reasons people gave for being pro or con independence, to accentuate the positive and eliminate the negative for No, and to accentuate the negative and eliminate the positive for Yes.
There’s a big challenge in all this, not least the fact that the gnomes at SNP central will be trawling all this information to achieve exactly the opposite effect. The other main parties, quite rightly from a unionist point of view, will be concentrating much of their effort on contributing positively to UK politics and may take their eye off this particular ball. And there are three of them whereas, for all practical purposes, there is only the SNP on the other side.
But this paradoxically may be a great strength for those of us who believe in the union. It could reverse the perception during the referendum, false in my view but it was there, that the unionists were a monolithic bloc and the separatists a bottom-up community driven campaign. There are already a number of non-party pro-union groups active (I may touch on them in a future post) and I’m sure they’ll be looking at all this information in a creative way that the monolithic SNP may miss.
Let’s hope so.

If you didnt watch yesterdays sunday politics scotland, you really should. Snp angus robertson has a car crash interview as the spurious nature of the snps election positions become clear.
LikeLike
Your analysis also ignores that as people age they become more conservative with a small c. So waiting for the old to die off either to get a Marxist revolution aka Corbyn or Indy does not work, they are just replaced by younger people who change their minds.
LikeLike